A Tool To Compare Spending Choices
- December 26, 2017
- by Emily

When you talk to financial planners—and read about personal finance—it’s easy to become overwhelmed with the "shoulds". You should put more money away, you should pay off your student loans, you should stop spending so much on eating out…
It’s sometimes hard, though, to visualize the big picture when it comes to making relatively small changes in your spending habits. That’s one of the ways that the Income and Spending Simulator’s compare mode can be a powerful tool. Here are some of the ways you can see what happens when you multiply minor spending changes over the course of decades.
Saving an extra $100
Could you cut $100 from your monthly spending and invest it instead? If you did, how much of a difference would it make?
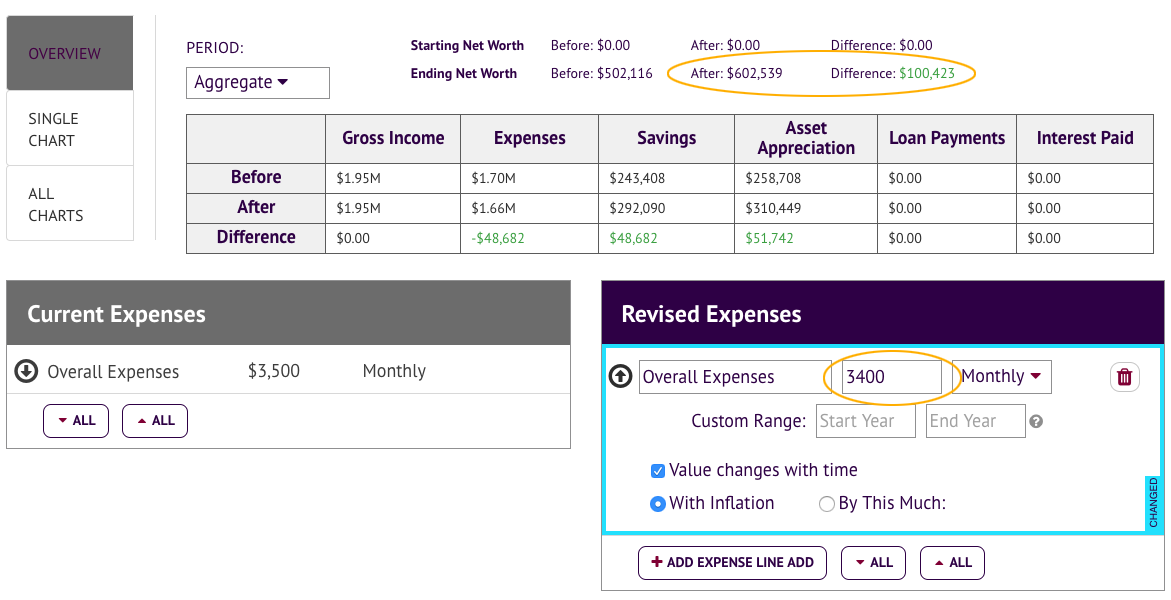
Using the Income and Spending Simulator, I took a hypothetical individual who currently earns $4000 per month and spends $3500 per month. To keep things simple, I kept the other fields blank. This person has no assets or loans, taxes are left out, and his or her spending and income is only going increase by inflation over the next 30 years. If this hypothetical person maintains spending habits and gets a 5% return rate on the $500 being saved each month then after 30 years their net worth comes to $502,116.
So, what happens if he or she shaves $100 off the monthly expenditures and invests it instead? Using the compare mode (Tools -> Compare) I can see what happens.
With $3400 in expenses and $600 going to savings every month, this person would have $100,423 more, for a total of $602,539.
Here is a link to the simulation.
Basically, over a thirty-year time frame with 5% rate of return, you’ll have around $100,000 in net worth for every $100 you’re investing per month.
Making an Extra Payment
Now let’s look at another scenario. We'll add a house with a mortgage to the simulation. We'll stick with $3500 in total expenses ($955 for a 30 year mortgage loan at 4%, and $2545 for everything else). We'll assume the home is worth $250,000. The $50k down payment came from the sky. Again for simplicity sake we'll exclude taxes, insurance, etc.
This scenario ends up with a lot more in the end. First we've assumed the home grows in value by 3% per year. After 30 years of compounding the value of the home is expected to be $606k. The $50k down payment allowed access to all those gains. Meanwhile, each month the person is paying their mortgage. With each payment the principal portion goes straight towards their net worth.
At the end of 30 years, he or she will have a $1.31M net worth, or about $800,000 more than if he or she had been using that money towards rent every month.
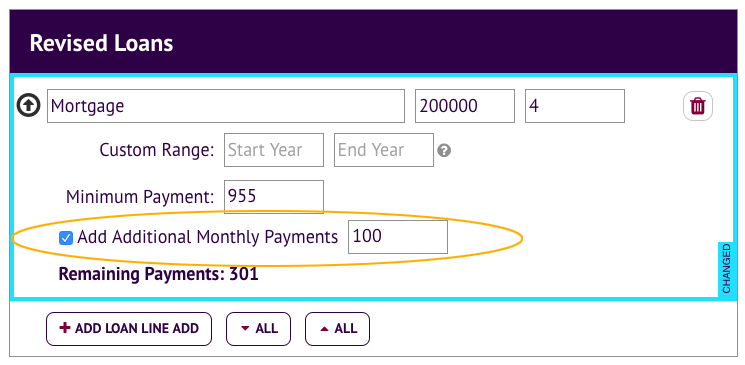
But here’s another question. What if he or she pays an extra $100 on the mortgage instead of investing or saving it? Let’s use the compare mode again.
By paying ahead on the mortgage $100 each month instead of saving and investing the $100, after 30 years the person actually has $10,312 less in net worth.
Why? Because we’re assuming a return rate of 5% on savings, but the mortgage is only 4%. So it’s actually better for long-term financial health for the person to invest his or her money and pay just the minimum payment on his or her mortgage. The flip side of that is they end up paying $26,835 less in interest, which is a guaranteed return, vs the 5% return the simulator uses is far from a promise.
Here is the link to the simulation that includes the mortgage.
Using the Income and Spending Simulator’s compare mode is a good way to visualize how small changes in your spending, savings and investing habits can make a big difference in your overall financial picture in the long term.
Want to play around with the scenarios I’ve just described? Follow the links (saving $100, add mortgage), click Save As..., or go to Tools -> Compare to run your own numbers.


